How Is Montreal Preparing for More Spring Floods?
Maps, Geography, and Lots of Rain
Since the earliest civilizations, great floods have impacted human life.
From the Bible to Greek mythology to First Nations mythology, accounts of these floods are often mentioned.
Fast forward to today: the geological epoch known as the Holocene. With changing climates globally, extreme weather events are becoming more and more common.
Among these extreme events are floods.
Last year, Montreal experienced the wrath of a hundred-year flood, a flood that has a one-in-a-hundred chance of occurring at any given year.
“People don’t understand what that means, a hundred-year event,” says Dr. Pascale Biron, professor and Chair in Concordia’s Department of Geography, Planning, and Environment. “Every year you have a chance that this event would occur. It’s not like if you’ve got one that you’re off the hook for the next 99 years.”
Is Montreal prepared for another flood?
To prepare for this kind of situation, city planners need flood maps that show zones susceptible to flooding. The problem is, flood maps for Montreal are very difficult to find.
“The coverage of flood mapping in Montreal is a huge issue, as many regions along the coast of the island do not have flood maps available,” says Gabrielle Bruser, a Concordia student researching floods who uses the maps often. “The maps that are available are extremely out of date.”
Currently, the Centre d’expertise hydrique du Québec have some maps on their website that are publicly available.
Yet to find a map like this takes a lot of digging on the internet. On the contrary, the United Kingdom has maps that are easily accessible to the public, says Biron.
“All you need to do is enter an address, and you’ll get there,” she says. “It’s super intuitive to use [the UK] site, whereas it’s not to use [the CEHQ maps].”
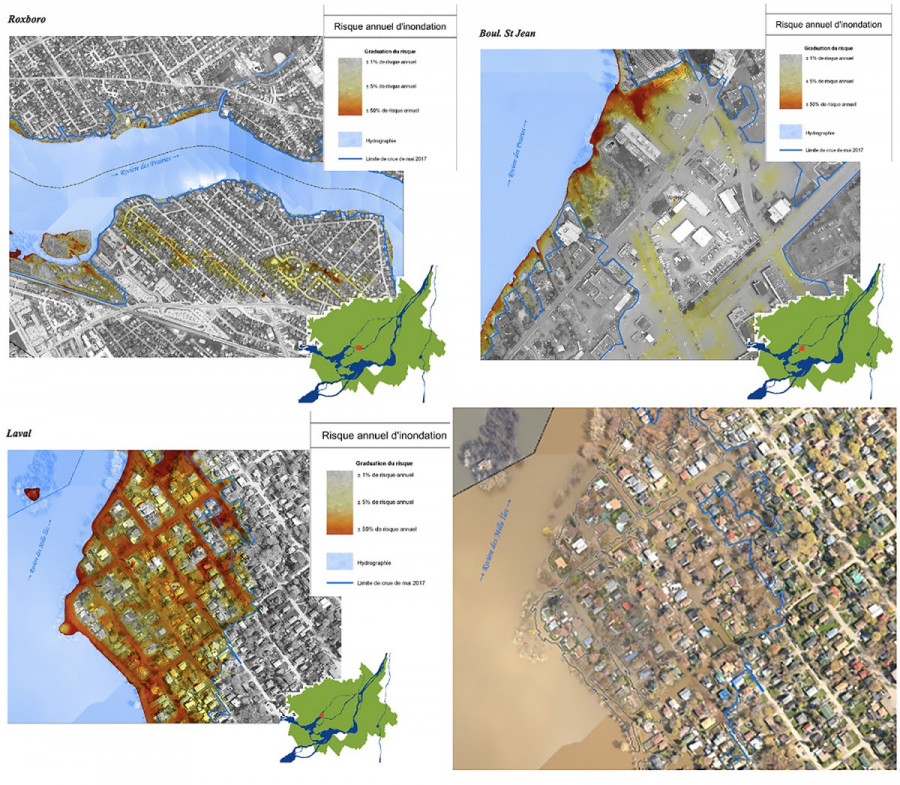
Recently, the Communauté métropolitaine de Montréal, a planning group for the city, has provided some newer flood maps.
In comparing the new CMM maps to the CEHQ maps, says Biron, “you can see they offer more of a gradient of risk level which is ideal because flood predictions are uncertain and shouldn’t be presented as a concrete boundary.”
“It’s extremely touchy, this question of flood maps,” Biron adds. By making a flood map, areas at risk are outlined and this can reduce the value of the land. Houses in high-risk zones can have higher insurance, too. “It has really serious consequences for people. You can’t just do this from a scientific perspective and ignore the reality on the ground.”
How else is the city prepared for flooding?

Since January 2008, 18 automatic water level monitoring stations were set up for the Des Prairies and St. Lawrence rivers. The system identifies three alert levels according to established water level thresholds. The table on the left shows the response by city and borough officials in response to each level.
Montreal has had a history of flooding.
The mid 70s and late 80s both saw severe flooding events. Last May, due to excessive snowmelt, spring floods devastated the western end of the island.
“Even leading up to May 1, when we saw all the flooding that occurred in Quebec, we had almost double the amount of rain precipitation and [snow] precipitation in February, March, and April,” says David Phillips, senior climatologist at Environment Canada.
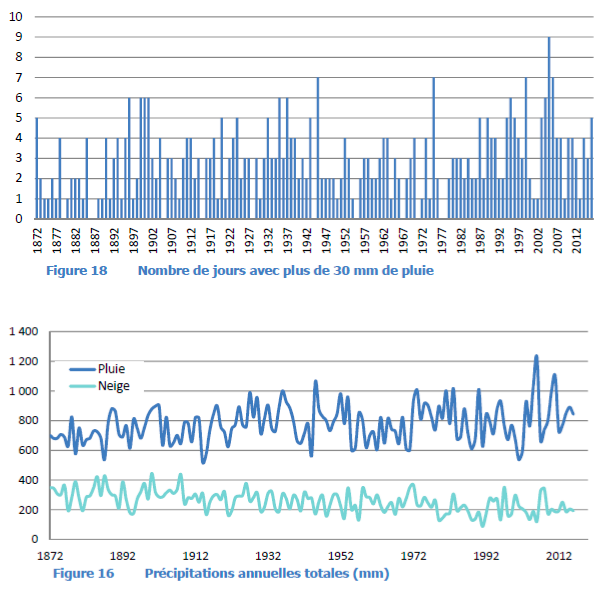
Flooding is reliant not only on the frequency of rainfall, but also the intensity, or how much rain falls at a time. The graph above shows the number of days with more than 30mm of rainfall in Quebec per year, going back to 1872.
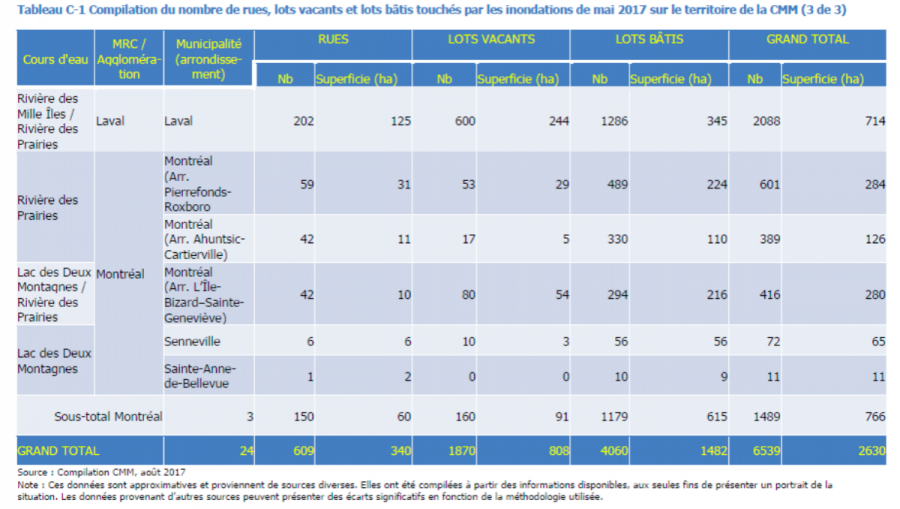
With last year’s floods, damages amounted to $117 million in Quebec and Ontario, according to Insurance Bureau of Canada. The table above shows the quantity of damages experienced in Laval and Montreal.
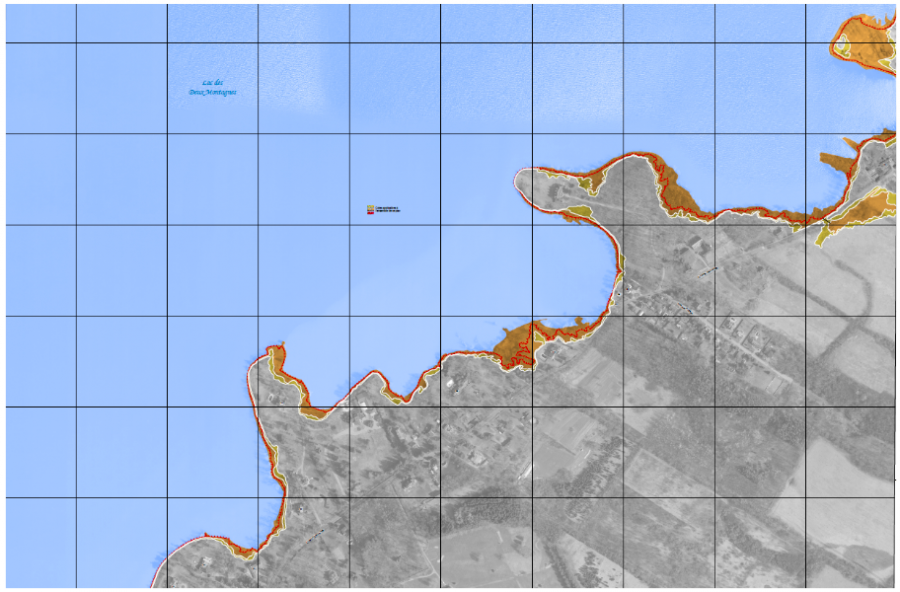
Should large flooding events happen again, the maps on the left are the areas in Montreal that will be affected.


_600_375_90_s_c1.jpg)